Dashboard ·
Mapping the 2019 Iran flood, a case study in Khuzestan province
Mapping the 2019 Khuzestan flood using publicly available satellite imagery. Estimating the exposure of people and infrastructure within the flooded area.
Contents
- Introduction
- Creating the flood map
- The flood
- By county
- The map
- The flood over time
- Infrastructure
- How the map was made
- Downloads
- Notes
- References
Introduction
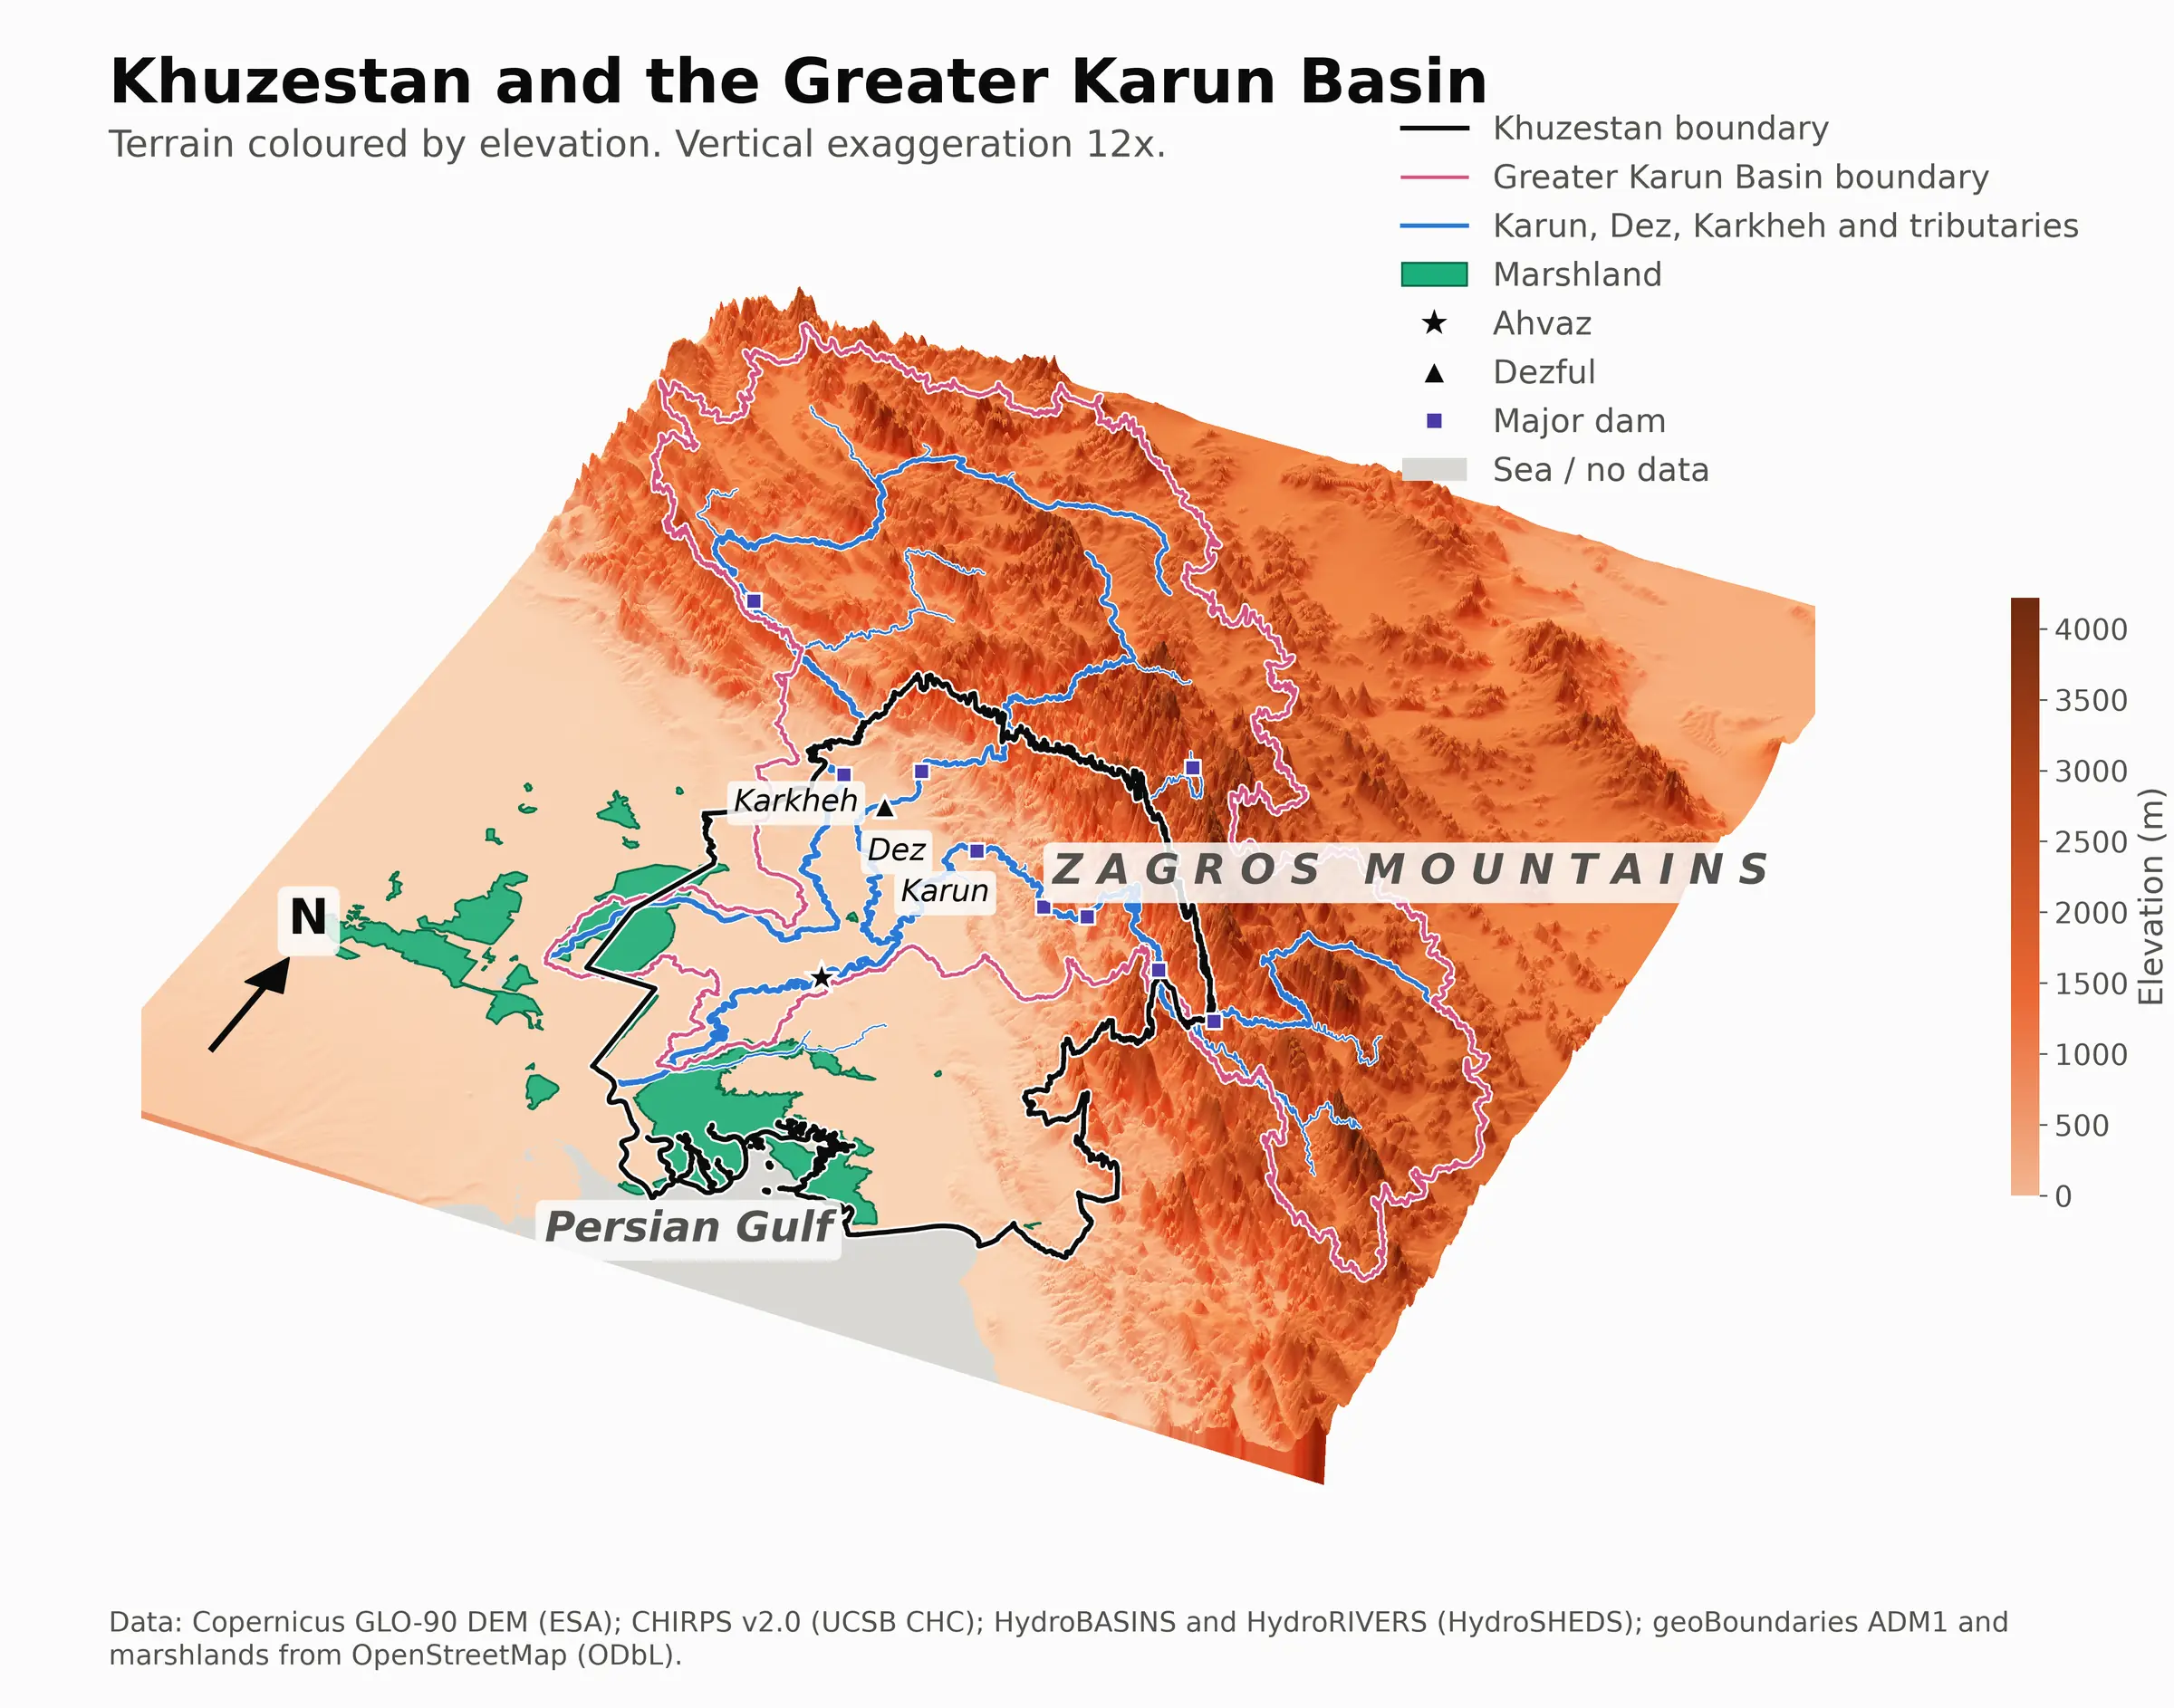
Khuzestan is a province in south-western Iran, between the Zagros Mountains and the Persian Gulf. The north-eastern part of the province is mountainous, while the rest is mostly flat, low-lying farmland and wetland. It borders Iraq to the west and the Persian Gulf to the south.
Khuzestan holds 28.8% of the Greater Karun Basin lies inside Khuzestan, 33,077 km². of the , Iran’s largest surface water system, carrying about The Karun and the Dez are Iran's largest surface water system, with an average annual flow of 19,174 million m³. Farjam, M., Kalantari, K., Asadi, A. and Barati, A. (2026). Assessing governance, policy, and operational gaps driving the water crisis in Iran's Greater Karun Basin. Environmental Challenges, 101670. https://doi.org/10.1016/j.envc.2026.101670. The basin produces The Greater Karun catchment produces 78% of Iran's hydroelectric energy. Farjam, M., Kalantari, K., Asadi, A. and Barati, A. (2026). Assessing governance, policy, and operational gaps driving the water crisis in Iran's Greater Karun Basin. Environmental Challenges, 101670. https://doi.org/10.1016/j.envc.2026.101670 of Iran’s hydroelectric energy. Its major rivers include the Karun, the Dez and the Karkheh, which form the Karun River System. The Karun is the longest river in Iran, at The Karun is the longest river in Iran at 950 km. Farjam, M., Kalantari, K., Asadi, A. and Barati, A. (2026). Assessing governance, policy, and operational gaps driving the water crisis in Iran's Greater Karun Basin. Environmental Challenges, 101670. https://doi.org/10.1016/j.envc.2026.101670.
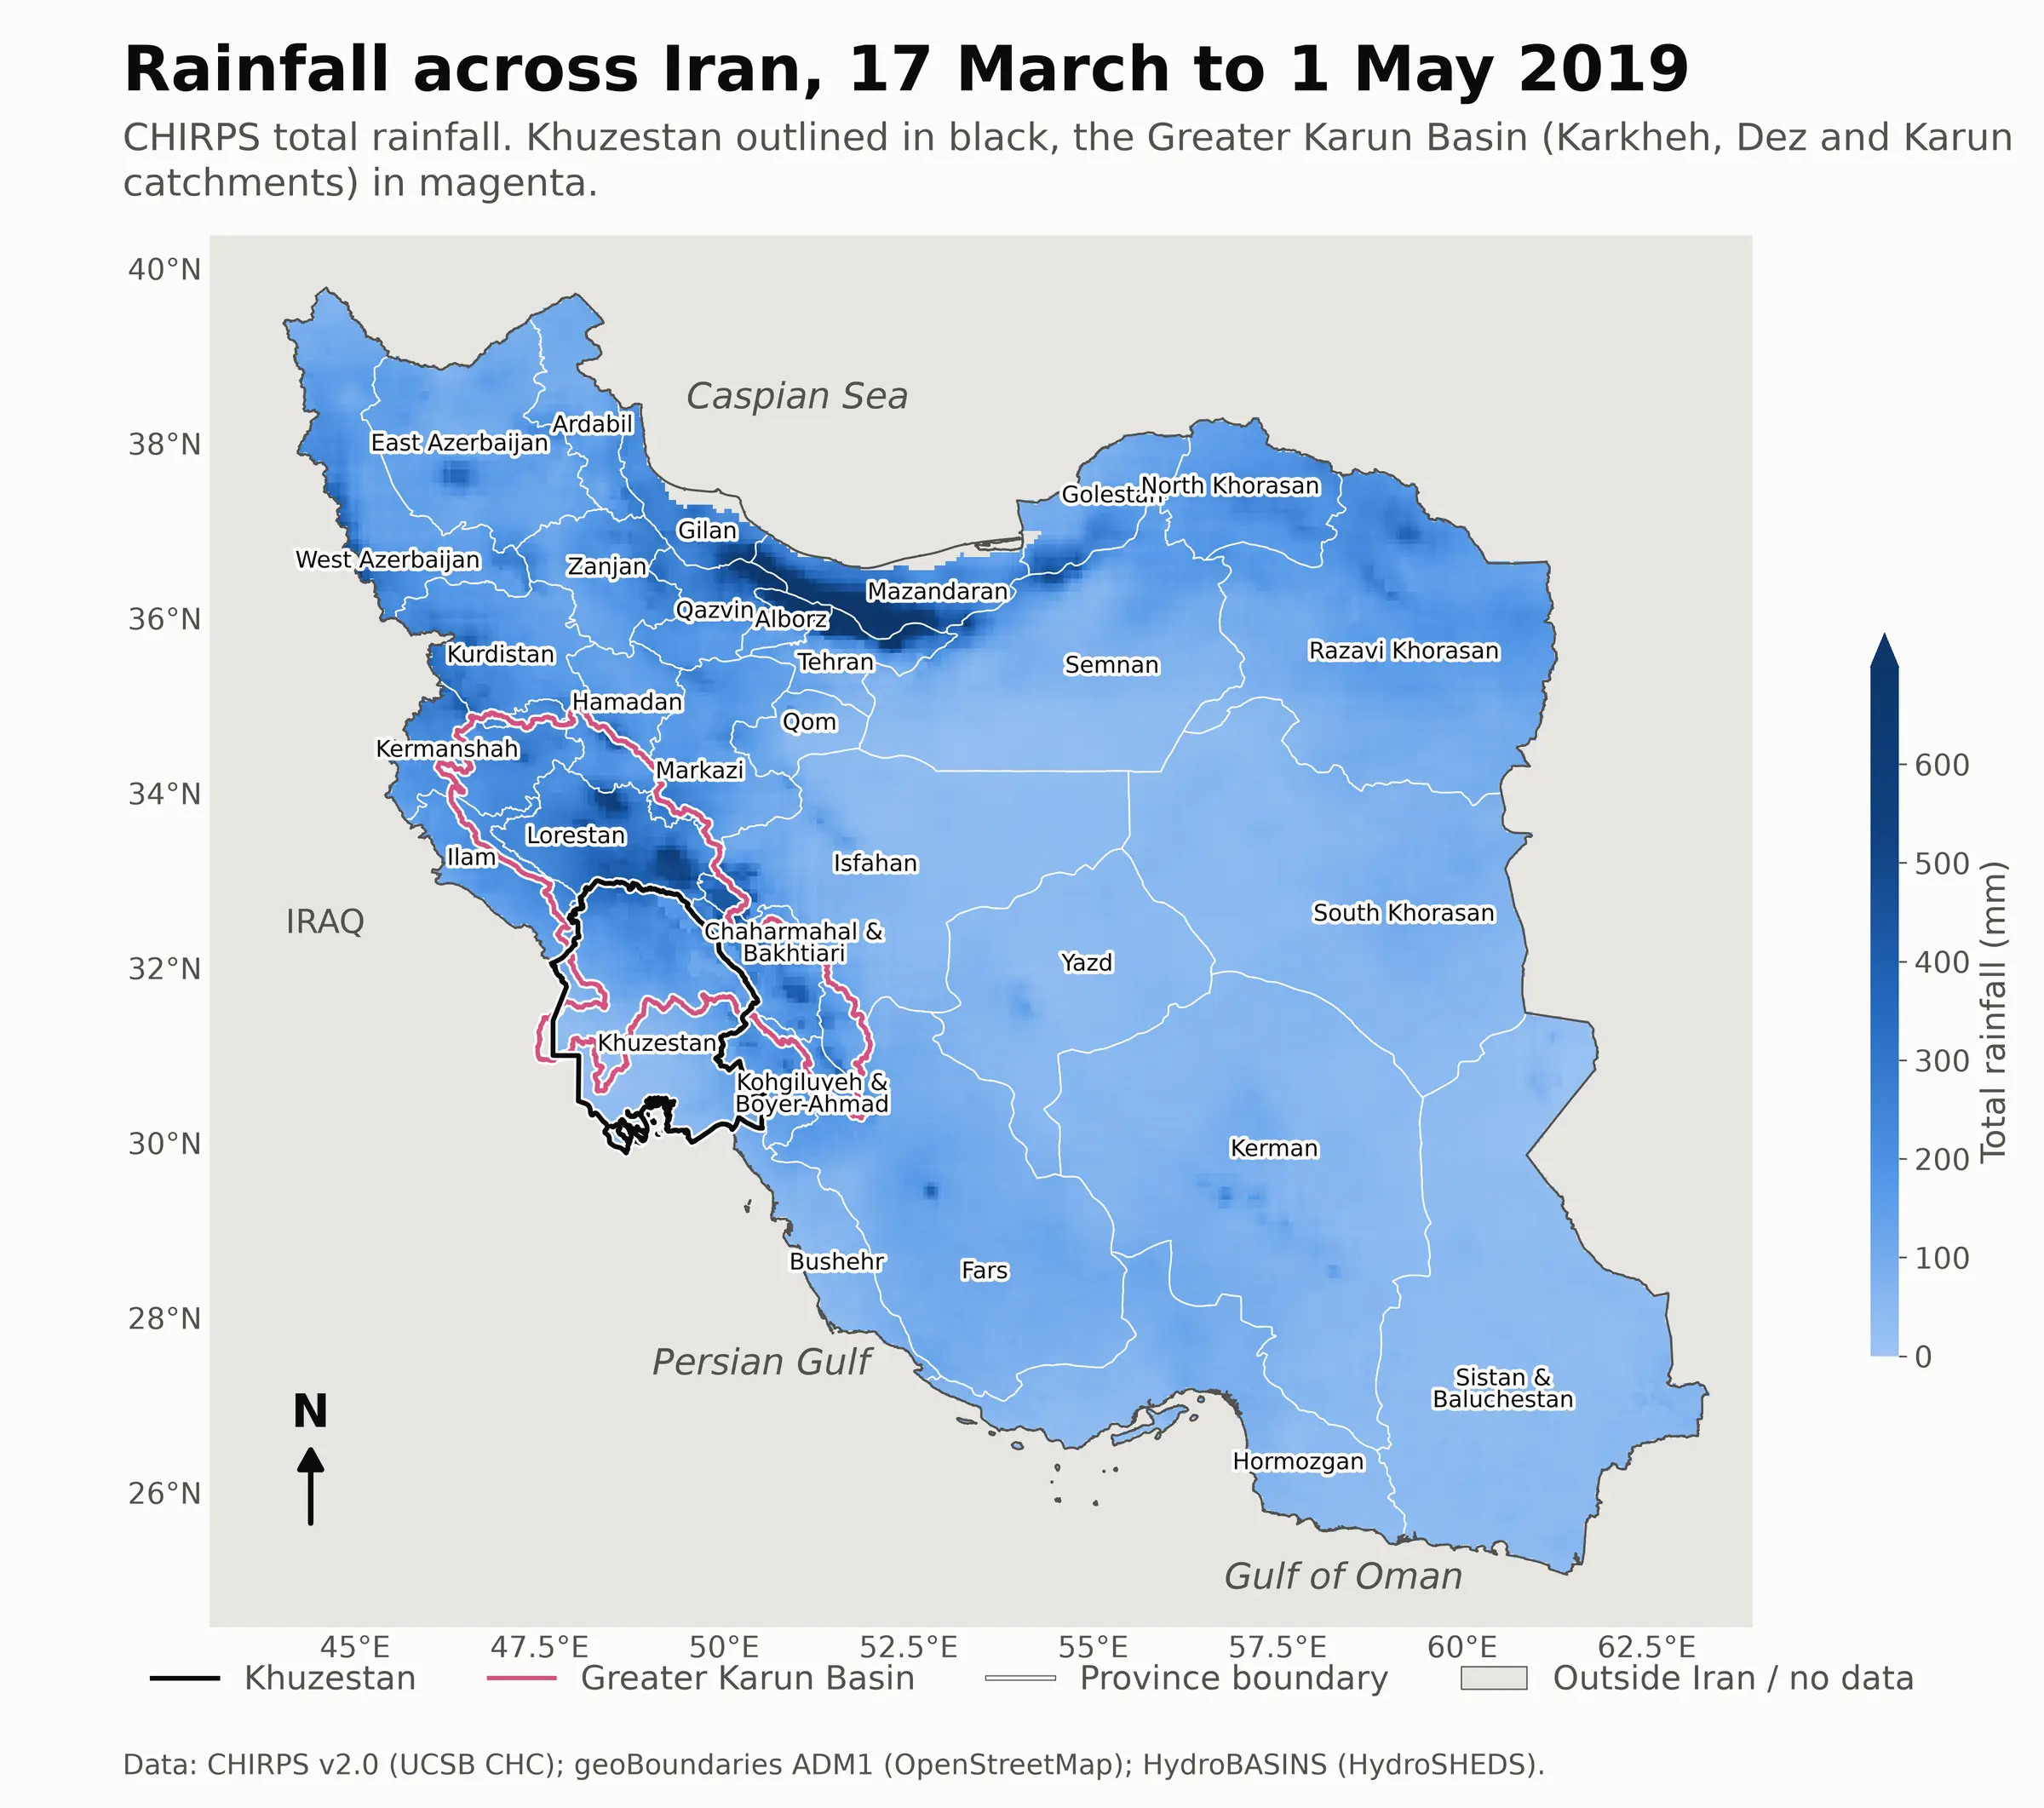
In the spring of 2019, Iran had some of the most extreme flooding in its recorded history. Heavy rain fell in three periods, between 17 March and Heavy rain fell over Iran in three periods between 17 March and 1 April 2019. Fazel-Rastgar, F. (2020). Extreme weather events related to climate change: widespread flooding in Iran, March-April 2019. SN Applied Sciences 2(12), 2166. https://doi.org/10.1007/s42452-020-03964-9. By the estimate, part of the upper Karun headwaters received The heaviest single day at any cell of the Greater Karun Basin was 153.1 mm on 31 March 2019, in Chaharmahal and Bakhtiari. of rain on 31 March alone. From 17 March to 1 May, the Greater Karun Basin received The Greater Karun Basin received 226.4 mm of rain on average from 17 March to 1 May 2019. on average. The Karkheh within it had one and a half times its The Karkheh basin received 179 mm in the March and April 2019 rain, 1.5 times its five-decade record. Fazel-Rastgar, F. (2020). Extreme weather events related to climate change: widespread flooding in Iran, March-April 2019. SN Applied Sciences 2(12), 2166. https://doi.org/10.1007/s42452-020-03964-9.
The flood affected More than 10 million people were affected by the 2019 floods across Iran, by the PDNA's account. United Nations and Plan and Budget Organization of the Islamic Republic of Iran (2019). Post Disaster Needs Assessment: Iran 2019 floods in Lorestan, Khuzestan and Golestan provinces. United Nations Iran, October 2019. https://iran.un.org/sites/default/files/2021-08/IRAN_FLOODS_2019_(Final_Report)_En_2019.pdf across Iran, and 46,000 people in Khuzestan were displaced into emergency shelters in the second week of April 2019, by the PDNA's account. United Nations and Plan and Budget Organization of the Islamic Republic of Iran (2019). Post Disaster Needs Assessment: Iran 2019 floods in Lorestan, Khuzestan and Golestan provinces. United Nations Iran, October 2019. https://iran.un.org/sites/default/files/2021-08/IRAN_FLOODS_2019_(Final_Report)_En_2019.pdf in Khuzestan were displaced into emergency shelters. By 5 April 2019 it had damaged Nearly 12,000 km of road was damaged across Iran by 5 April 2019, the government reported. France 24 (2019). Iran floods death toll reaches 70. France 24, 5 April 2019. https://www.france24.com/en/20190405-iran-floods-death-toll-reaches-70 of road, or 36% of Iran's road network was damaged by 5 April 2019, the government reported. France 24 (2019). Iran floods death toll reaches 70. France 24, 5 April 2019. https://www.france24.com/en/20190405-iran-floods-death-toll-reaches-70 of Iran’s national road network. The put the damage in Golestan, Lorestan and Khuzestan at The PDNA put damage in Golestan, Lorestan and Khuzestan at IRR 128,043.04 billion, USD 1,217.33 million. United Nations and Plan and Budget Organization of the Islamic Republic of Iran (2019). Post Disaster Needs Assessment: Iran 2019 floods in Lorestan, Khuzestan and Golestan provinces. United Nations Iran, October 2019. https://iran.un.org/sites/default/files/2021-08/IRAN_FLOODS_2019_(Final_Report)_En_2019.pdf, of which Agriculture was 18.00% of the damage the PDNA assessed, with Khuzestan's agricultural damage not available. United Nations and Plan and Budget Organization of the Islamic Republic of Iran (2019). Post Disaster Needs Assessment: Iran 2019 floods in Lorestan, Khuzestan and Golestan provinces. United Nations Iran, October 2019. https://iran.un.org/sites/default/files/2021-08/IRAN_FLOODS_2019_(Final_Report)_En_2019.pdf was agricultural damage.
Khuzestan was one of the most severely affected provinces in flood extent and damage. However, this was not due to the heavy rain alone. From 17 March to 1 May 2019 the province received Khuzestan received 116.6 mm of rain on average from 17 March to 1 May 2019, by the CHIRPS estimate. on average, Khuzestan ranks 21st of Iran's 31 provinces by rain from 17 March to 1 May 2019. of Iran’s provinces. Lorestan received Lorestan received 317.5 mm of rain on average from 17 March to 1 May 2019, 2.7 times Khuzestan's. , and Chaharmahal and Bakhtiari Chaharmahal and Bakhtiari received 224.5 mm of rain on average from 17 March to 1 May 2019. .
About 71.2% of the Greater Karun Basin lies outside Khuzestan. of the Greater Karun Basin lies outside Khuzestan, over the Zagros Mountains. These were among the wettest parts of Iran during the period. Khuzestan sits at the bottom of this catchment. Its three major rivers, the Karun, the Dez and the Karkheh, funnel the water down into the province’s flat lowlands and waterlogged marshes (the Karun floodplain), where About 4 million people live on the Karun floodplain, by Heidari's 2014 account, which states no source or year. Heidari, A. (2014). Flood vulnerability of the Karun River System and short-term mitigation measures. Journal of Flood Risk Management 7(1), 65. https://doi.org/10.1111/jfr3.12032 live.
This page attempts to map the extent of flooding across Khuzestan province between March and May, the height of the flood period. We then use that map to estimate the exposure of people and infrastructure to the flood. This is not an attempt to measure damage or count the number of people affected. Nor is it intended to compete with figures published by organisations or the Iranian authorities. Instead, the aim is to tell the story of the flood using publicly available data, as an educational tool and to raise awareness of the severity of this event and others like it.
Creating the flood map
To measure flood exposure, we need a map showing where the flood reached. There are two publicly available geospatial flood-map products for the region. The first is the Copernicus Global Flood Monitoring product ( ), which automatically maps flooding using imagery (technical information). The second is the of 8 April 2019, produced by the Copernicus Emergency Management Service in response to the crisis. The same activation produced a series of maps of the affected region, based on imagery from and Copernicus EMS mapped 11 towns in Khuzestan from Pléiades, WorldView-2 and DEIMOS-2 imagery at 0.5 to 0.75 m, flown 11 to 14 April 2019. Copernicus Emergency Management Service (2019). Rapid mapping activation EMSR352, Iran floods. Copernicus Emergency Management Service. https://mapping.emergency.copernicus.eu/activations/EMSR352/. Organisations and authorities used them to assess the extent of flooding and plan the emergency response.
Both products use imagery from the same Sentinel-1 sensor, which uses radar to detect features on the Earth’s surface. We decided not to include the EMSR352 delineation in our flood map because it shares the GFM’s radar limitations (see below), covers only a single day, 8 April, and does not image the whole region. It covers only The EMSR352 delineation of 8 April 2019 images 70.7% of Khuzestan outside permanent water. of the province outside permanent water. It would therefore add little to the GFM’s coverage of how the flood changed over time. The GFM, by contrast, observes the whole region on The Global Flood Monitoring product observes ground in Khuzestan on 52 dates across March to June 2019. dates, in The Global Flood Monitoring dates over Khuzestan from March to June 2019 form seven 12-day windows. that run from when the flood started to when it ended.
Radar can see through clouds, making it useful for mapping the ground when it is cloudy. However, it can mistake smooth surfaces such as wet soil, mudflats and sand after rain for water. It also cannot see water between buildings or under vegetation. The GFM intentionally leaves out areas where its algorithm is considered unreliable. In Khuzestan, those areas cover The Global Flood Monitoring product never judges 53.4% of Khuzestan, because it excludes that ground on every date. of the province.
There are other options, though. Optical imagery from public satellites such as and can detect water directly, but clouds can block the view. On several days during the flood period, parts of the region were visible through the clouds, and on some days the region was almost completely cloud-free. We therefore decided to classify this imagery, from The optical record of the flood is 11 dates from 16 March to 7 June 2019, on Sentinel-2 and Landsat 8. dates between March and June 2019, to try to map some of the areas the GFM excludes. However, the resulting still cannot detect flooding in built-up areas, or where there is cloud.
To classify water pixels in satellite imagery as floodwater, we first need to establish a showing where water was present before the rain started. We built this from a publicly available dataset, the Global Surface Water record, and a clear optical image of the region taken on 16 March 2019, before the rain. The JRC record shows how often water has been observed in each location over time, while the image shows where water was visible just before the flood. Together, they help us distinguish newly flooded areas from water that was already present, such as lakes, rivers and some seasonal irrigation water. In March the baseline is known for The March baseline is known for 98.9% of Khuzestan outside permanent water. of the province.
By combining the GFM with the optical map we produced from Sentinel-2 and Landsat 8 imagery, we get a more complete view of the flood’s extent over the period. With this new , we can then measure the exposure of people and infrastructure to the flood more reliably.
The flood
The hybrid map covers a total of The hybrid flood map, the optical flood of 27 March to 7 June 2019 less the hill block combined with the radar flood of 15 March to 6 June, covers 5,959 km². , or The hybrid flood map of 15 March to 7 June 2019 covers 9.6% of Khuzestan outside permanent water. of the province outside , from 15 March to 7 June 2019.1 We used it to estimate the total flooded area, as well as the cropland, residents and infrastructure that fell within the flood extent. It holds 98,418 residents live inside the hybrid flood map of 15 March to 7 June 2019, by the WorldPop 2020 grid. residents, with The hybrid flood map of 15 March to 7 June 2019 holds 1,886 km² of WorldCover 2020 cropland. of cropland and 313 km of major road lies inside the hybrid flood map of 15 March to 7 June 2019 on the OpenStreetMap snapshot of 1 January 2019. of major road. This does not mean that all the residents or infrastructure counted here were affected by the flood. Rather, it gives an estimate of potential .
- Share of the province
- 9.6%
We estimated the number of using WorldPop 2020, the using WorldCover 2020,23 and the using the OpenStreetMap snapshot of 1 January 2019. All three are publicly available datasets.
By county
The table ranks Khuzestan’s Khuzestan has 27 counties in the geoBoundaries ADM2 layer. by flooded area on the hybrid map. Each row breaks down the county’s flood exposure using the measures described above. Ahvaz has the highest number of potentially exposed residents, at Ahvaz is the county with the most residents inside the hybrid flood map of 15 March to 7 June 2019, 29,316. . Shadegan has the largest flooded area, at Shadegan is the county with the largest area inside the hybrid flood map of 15 March to 7 June 2019, 1,080.0 km². .
| County | Flood km² | Standing water km² | Residents | Cropland km² | Roads km |
|---|---|---|---|---|---|
| Shadegan | 1,080 | 842.3 | 26,551 | 285.4 | 36.9 |
| Abadan | 907.4 | 303 | 865 | 13 | 2.2 |
| Ahvaz | 672.9 | 53.7 | 29,316 | 438.7 | 67 |
| Bandar-e-Mahshahr | 590.6 | 147.1 | 1,258 | 14.1 | 4.2 |
| Hoveyzeh | 563.6 | 152.2 | 2,925 | 59.4 | 33.2 |
| Karun | 410.7 | 17.6 | 13,282 | 219.7 | 33.2 |
| Dasht-e-Azadegan | 361.2 | 12.3 | 1,579 | 225.2 | 41.2 |
| Shush | 316.8 | 16.3 | 10,218 | 197.8 | 29 |
| Shushtar | 248.6 | 14.7 | 3,077 | 191.7 | 24.7 |
| Hendijan | 225.6 | 17.5 | 51 | 8.8 | 0.6 |
| Khoramshahr | 182.8 | 283.7 | 1,145 | 39.6 | 4.4 |
| Bavi | 149.2 | 6.3 | 3,831 | 108.4 | 18.8 |
| Hamidieh | 64.7 | 13.7 | 898 | 47.4 | 13 |
| Dezful | 60.9 | 15.5 | 1,517 | 14.9 | 0.3 |
| Omidieh | 28.6 | 15.3 | 50 | 3.8 | 0 |
| Izeh | 22 | 41.6 | 597 | 4.5 | 0 |
| Andimeshk | 17.7 | 18.1 | 187 | 2.5 | 0.4 |
| Ramshir | 14.5 | 3.7 | 56 | 4.4 | 0.6 |
| Gotvand | 7.2 | 2.4 | 875 | 1.2 | 0.1 |
| Andika | 6.2 | 8.9 | 8 | 0.9 | 0.1 |
| Masjedsoleyman | 5.9 | 3.4 | 0 | 1.3 | 1.1 |
| Behbahan | 5.6 | 4.8 | 132 | 0.3 | 0.1 |
| Lali | 5.1 | 1.7 | 0 | 0.4 | 1.9 |
| Haftgol | 3.7 | 0.3 | 0 | 1 | 0 |
| Ramhormoz | 2.9 | 1.3 | 0 | 0.8 | 0 |
| Baghmalek | 0.9 | 0.5 | 0 | 0.1 | 0 |
| Aghajari | 0.3 | 0.7 | 0 | 0 | 0 |
The map
The map below shows the three flood maps used in this analysis: the optical map we produced using Landsat 8 and Sentinel-2 imagery; the GFM, which uses Sentinel-1 radar imagery; and the hybrid map, which combines both across the full period.
Both the optical and the radar maps have a slider to change the period. The optical map steps through Ten of the 11 optical dates follow the 16 March view the baseline reads and form the event set. dates, and the GFM through The Global Flood Monitoring dates over Khuzestan from March to June 2019 form seven 12-day windows. windows of 12 days.
Legend
- flood
- water before the rain
- not mapped
The hybrid map layer covers The hybrid flood map, the optical flood of 27 March to 7 June 2019 less the hill block combined with the radar flood of 15 March to 6 June, covers 5,959 km². , or The hybrid flood map of 15 March to 7 June 2019 covers 9.6% of Khuzestan outside permanent water. of the province outside permanent water. Ground a layer does not judge is .
The flood over time
The following chart measures flood area from the GFM in each window, on the ground every window observes, with the baseline removed. A window with no image is a gap, not a zero.
This shows the peak of the flooding to be between 8 and 19 April, at The GFM radar flood peaked in the window of 8 to 19 April 2019, at 2,042.7 km² on the ground every window observed. . The chart is radar alone. Cloud hid the flooded ground from both optical satellites between 9 and 20 April.4 Too little ground is clear on every Sentinel-2 date to build an optical series.5
Infrastructure
Using an extract of OpenStreetMap data, the of 1 January 2019, we can count infrastructure features exposed to the flood.6 A feature is counted as when it is touched by a flood pixel. The second column counts features within 50 m of a flood pixel. Pipelines, power lines, dykes, canals, drains and railways are measured in kilometres.
| Class | Mapped | Reached | Within 50 m |
|---|---|---|---|
| settlements | |||
| villages and hamlets | 2,160 | 88 | 173 |
| towns | 87 | 6 | 12 |
| residential areas | 1,317 | 123 | 337 |
| buildings | |||
| houses | 2,303 | 0 | 1 |
| industrial buildings | 203 | 2 | 4 |
| other buildings | 11,137 | 235 | 868 |
| industry | |||
| industrial estates | 1,026 | 72 | 138 |
| works and plants | 77 | 7 | 18 |
| farmyards | 140 | 7 | 22 |
| oil and gas | |||
| wells and well sites | 421 | 2 | 15 |
| oil and gas facilities | 93 | 0 | 0 |
| pipelines | 2,866 km | 39.3 km | 67 km |
| power | |||
| power plants | 11 | 0 | 2 |
| substations | 152 | 4 | 17 |
| towers and poles | 36,701 | 2,756 | 5,330 |
| lines | 1,477 km | 573.5 km | 940 km |
| water | |||
| pumping stations | 245 | 30 | 104 |
| water towers | 139 | 2 | 8 |
| wastewater plants | 32 | 8 | 13 |
| dams and weirs | 213 | 12 | 37 |
| dykes and embankments | 120 km | 0.3 km | 23.1 km |
| canals | 1,765 km | 470.1 km | 942.2 km |
| drains and ditches | 9,102 km | 288.8 km | 603.7 km |
| storage and waste | |||
| storage tanks | 2,190 | 24 | 50 |
| silos | 17 | 0 | 2 |
| landfills | 481 | 45 | 51 |
| health | |||
| hospitals | 88 | 1 | 8 |
| clinics and pharmacies | 75 | 0 | 0 |
| education | |||
| schools | 178 | 0 | 0 |
| universities and colleges | 44 | 2 | 4 |
| emergency and civic | |||
| police and fire stations | 83 | 2 | 5 |
| shelters and military sites | 98 | 20 | 30 |
| places of worship | 269 | 3 | 5 |
| banks, post offices and markets | 243 | 0 | 1 |
| transport | |||
| airfields and helipads | 89 | 6 | 8 |
| railway | 605 km | 27.8 km | 151.9 km |
| railway and bus stations | 70 | 1 | 3 |
| fuel stations | 234 | 1 | 8 |
| recreation | |||
| parks and pitches | 1,011 | 43 | 69 |
| stadiums and sports centres | 83 | 2 | 2 |
| cemeteries | 131 | 3 | 14 |
Major roads reached: 313.2 km. Buildings on the 2019 snapshot: 13,643.
For example, 88 villages and hamlets on the 2019 OpenStreetMap snapshot were reached by the hybrid flood map of 15 March to 7 June 2019. villages were reached by the flood, and a total of 173 villages and hamlets on the 2019 OpenStreetMap snapshot lay within 50 m of the hybrid flood map of 15 March to 7 June 2019. villages were within 50 m of it. 1 hospital on the 2019 OpenStreetMap snapshot was reached by the hybrid flood map of 15 March to 7 June 2019. was reached, and 8 hospitals on the 2019 OpenStreetMap snapshot lay within 50 m of the hybrid flood map of 15 March to 7 June 2019. were within 50 m. Of the power plants, No power plant on the 2019 OpenStreetMap snapshot was reached by the hybrid flood map of 15 March to 7 June 2019. was reached, and 2 power plants on the 2019 OpenStreetMap snapshot lay within 50 m of the hybrid flood map of 15 March to 7 June 2019. were within 50 m of the flood. A feature reached by water is exposed.7
Major road inside the hybrid map is 313 km of major road lies inside the hybrid flood map of 15 March to 7 June 2019 on the OpenStreetMap snapshot of 1 January 2019. on the 2019 snapshot.8 A building is counted by its distance to water, never by its own pixels.9 The three building rows hold The three building rows hold 13,643 elements inside Khuzestan on the OpenStreetMap snapshot of 1 January 2019. features in 2019 and The three building rows hold 24,507 elements inside Khuzestan on the OpenStreetMap snapshot of 17 August 2026. in 2026.10
How the map was made
The imagery
The optical record is The optical record of the flood is 11 dates from 16 March to 7 June 2019, on Sentinel-2 and Landsat 8. dates of Sentinel-2 and Landsat 8, from March to June 2019. Cloud and shadow are removed with the band of Sentinel-2 and the band of Landsat 8. Ground under cloud on a date is .
Water is read from the normalised difference of green and shortwave infrared light. Water reflects green light and absorbs shortwave infrared, so the index is high over water. The threshold between water and land is set for each date and each 20 km tile, on a grid in . A tile’s threshold follows the water its own scene holds.
The baseline
Each month has its own baseline: the water the JRC record normally shows in that month from 2014 to 2018, and the water that stood before the rain. JRC’s normal water is ground it saw as water in at least half of the years it observed. Water stood before the rain where JRC’s February 2019 record and the clear Landsat 8 view of 16 March 2019 both show it. An optical date takes the baseline of its month, and a radar window the month of its first day.
In March, 1.1% of Khuzestan outside permanent water has no March baseline and no optical flood figure. of the province has no baseline.11 That ground is and never flood.
The GFM
The GFM is automatic and global. It observes Khuzestan on The Global Flood Monitoring product observes ground in Khuzestan on 52 dates across March to June 2019. dates from March to June 2019, grouped here into windows. It excludes ground where its own rules say radar cannot tell water from land, which is The Global Flood Monitoring product never judges 53.4% of Khuzestan, because it excludes that ground on every date. of the province.
The hybrid map
The hybrid map is every pixel the optical map or the GFM calls flood from 15 March to 7 June 2019, with the baseline removed from each. The optical map gives its ten dates from 27 March to 7 June, and the GFM its seven windows from 15 March to 6 June. A pixel neither map judges is not mapped. The span ends on 7 June, the last optical date.
Flood on the , on the north-eastern hills, is drawn on each optical date and left out of the hybrid map.12
The rain
Rain is the CHIRPS daily estimate, summed from 17 March to 1 May 2019. A region’s mean is over the whose centre falls inside it.13 The Greater Karun Basin is traced through from four outlets, on the Karkheh, the Dez, the upper Karun and the Karun at Ahvaz.14 The daily chart runs from 10 March to 25 April, a week either side of the rain. The last day with a basin mean over 5 mm was 18 April, with The last day with over 5 mm of rain on average over the Greater Karun Basin was 18 April 2019, with 7.7 mm. . The terrain picture is drawn from with a 12 times . Neither picture states a figure.
Optical against radar
Optical imagery sees the colour of the ground, and cloud hides it. Radar sees through cloud, and reads any smooth surface as water, wet or dry. Neither sees water between buildings.
The layers
Each layer draws flood in red and water before the rain in blue. Not mapped is pale beige, and ground judged dry is left clear. The optical map layer shows one date, the GFM radar layer one window, and the hybrid map layer the whole span.
The delineation on 8 April
The delineation draws no layer and enters no figure. It is compared with the optical map and the GFM on 8 April 2019, from an image taken The EMSR352 delineation image of 8 April 2019 was taken 4.74 hours before the Sentinel-2 pass. before the Sentinel-2 pass. On the The optical map, the radar product and the delineation all judge 23,599 km² of Khuzestan on 8 April 2019. all three maps judge, the delineation maps The EMSR352 delineation maps 1,046.6 km² of flood on 8 April 2019 that neither the optical map nor the radar product maps. that neither other map does. That is The flood the EMSR352 delineation alone maps on 8 April 2019 is 36.9% of its own flood. of its own flood. The GFM maps The radar product maps 14.3 km² of flood on 8 April 2019 that neither the optical map nor the delineation maps. alone, The flood the radar product alone maps on 8 April 2019 is 1.1% of its own flood. of its own.
The infrastructure
Every feature keeps its OpenStreetMap shape: an area, a line or a point. An area is measured by the share of its pixels in the flood, a line by its length inside it, and a point by its distance to it. A building is measured by distance, because no sensor sees water between buildings. Features are counted on the 2019 snapshot, and the 2026 snapshot is in the download.
Validation
The optical map is scored against the six EMSR352 of 11 April 2019, drawn from sharp optical imagery over towns. It scores The optical map finds 86.1% of the flood the six EMSR352 grading products of 11 April 2019 map, with the April baseline removed from both. and 88.1% of what the optical map calls flood on 11 April 2019 falls inside the six EMSR352 grading products' flood. , with the baseline removed from both.15 Of the flood those products map, 5.4% of the flood the six EMSR352 grading products of 11 April 2019 map was water on the April baseline. was water before the rain.
Against the delineation of 8 April the optical map scores The optical map finds 47.2% of the flood the EMSR352 delineation of 8 April 2019 maps, with the April baseline removed from both. recall and 66.9% of what the optical map calls flood on 8 April 2019 falls inside the EMSR352 delineation's flood. precision.16 That measures how far two maps agree, not the accuracy of either.17
The data
- Sentinel-2 Collection 1 Level-2A over Khuzestan, eleven dates of 2019, European Space Agency, Collection 1 reprocessing, hosted by Element 84, version 2026-09-15, Copernicus free, full and open (Regulation (EU) No 1159/2013)
- Landsat 8 Collection 2 Level-2 over Khuzestan, four dates of 2019, United States Geological Survey, hosted by Microsoft Planetary Computer, version 2026-09-15, public domain, United States Geological Survey
- JRC Global Surface Water, seasonality, European Commission Joint Research Centre, version v1-4-2021, Copernicus free, full and open (Regulation (EU) No 1159/2013)
- JRC Global Surface Water, monthly history, European Commission Joint Research Centre, version ver5-0, CC-BY-4.0
- Copernicus Global Flood Monitoring over Khuzestan, 15 March to 14 June 2019, Copernicus Emergency Management Service, processed and hosted by EODC, version 2026-09-13, Copernicus free, full and open (Regulation (EU) No 1159/2013)
- Copernicus EMS activation EMSR352, vector products, Copernicus Emergency Management Service, Rapid Mapping, version 2026-09-10, © European Union, reuse permitted with attribution
- WorldPop constrained population count, Iran, 2020, WorldPop, University of Southampton, version 2020, CC-BY-4.0
- ESA WorldCover 10 m land cover map, 2020, European Space Agency, WorldCover consortium, version v100, CC-BY-4.0
- geoBoundaries Iran, ADM1 and ADM2, geoBoundaries, William and Mary geoLab, version 9469f09, ODbL-1.0
- OpenStreetMap extract for Iran, dated 2019-01-01, Geofabrik GmbH, version 2019-01-01, ODbL-1.0
- OpenStreetMap planet snapshot, OpenStreetMap contributors, version 2026-08-17, ODbL-1.0
- Natural Earth vector, GeoPackage package, Natural Earth, version 5.1.2, public domain
- Coastline water polygons, split, Mercator, osmdata.openstreetmap.de, version 2026-08-25, ODbL-1.0
- Land polygons, split, Mercator, osmdata.openstreetmap.de, version 2026-08-25, ODbL-1.0
- Daylight landcover, vectorised, Protomaps, from the Daylight Map Distribution, version 2026-08-24, CC-BY-4.0
- Wikidata QRank, Sascha Brawer, on Wikimedia Toolforge, version 2026-08-24, CC0-1.0
- Positioned Glyph Font encodings, wipfli, version 2026-08-24, MIT
- CHIRPS v2.0 daily rainfall, 17 March to 30 June 2019, Climate Hazards Center, University of California, Santa Barbara, version 2.0, CC0-1.0
- CHIRPS v2.0 daily rainfall, 10 to 16 March 2019, Climate Hazards Center, University of California, Santa Barbara, version 2.0, CC0-1.0
- HydroBASINS level 6, Europe and the Middle East, HydroSHEDS, World Wildlife Fund and McGill University, version 1c, HydroSHEDS Licence Agreement
- HydroRIVERS v1.0, Europe and the Middle East, HydroSHEDS, World Wildlife Fund and McGill University, version 1.0, HydroSHEDS Licence Agreement
- Copernicus GLO-90 digital elevation model, 49 tiles over Khuzestan and the Zagros, European Space Agency, hosted by Amazon Web Services, version 2026-09-26, Copernicus DEM licence
Downloads
- The three flood map layers of Khuzestan, spring 2019: , readable in .
- The 2019 flood in Khuzestan by county: .
- Infrastructure of Khuzestan measured against the 2019 flood: , both snapshots.
- The 2019 flood in Khuzestan over time, from radar: CSV.
- Rain over Iran's provinces and the Greater Karun Basin, March to May 2019: CSV.
Notes
- The hybrid map runs to 7 June 2019. Water that stood in May and June only in 2019, such as irrigation begun that year, is counted as flood. ↩
- WorldCover has no 2019 release, so the cropland map is the 2020 release, a year after the flood. Cropland is not published at pixel scale. ↩
- The cropland figure counts every WorldCover cropland pixel, sugarcane with wheat and barley, and names no crop. ↩
- No optical view of the flooded ground exceeds No optical view between 9 and 20 April 2019 is more than 58% clear over the flooded ground. clear between 9 and 20 April. Only the GFM covers those dates. ↩
- The ground every Sentinel-2 date saw clear is The ground every one of the nine Sentinel-2 dates from 27 March to 7 June 2019 sees clear is 5,118 km². , The ground every Sentinel-2 date from 27 March to 7 June 2019 sees clear is 8.1% of Khuzestan. of the province. That is too little common ground for a per-date optical series chart, so each optical date is drawn with its own not-mapped ground. ↩
- The snapshot is dated three months before the flood. Anything mapped between then and the flood is missing. ↩
- A facility reached by the water is exposure. Nothing on the page states damage, closure or loss. ↩
- In January 2016, OpenStreetMap held an estimated 0.25 of Iran's streets in January 2016. Barrington-Leigh, C. and Millard-Ball, A. (2017). The world's user-generated road map is more than 80% complete. PLoS ONE 12(8), e0180698. https://doi.org/10.1371/journal.pone.0180698 of Iran’s streets were in OpenStreetMap, so facility counts follow how much was mapped. ↩
- Neither radar nor optical sees water between buildings. WorldCover’s class reads 0.67% of the WorldCover built-up ground the optical map scores reads flooded on 8 April 2019. flooded on the optical map and 0.41% of the WorldCover built-up ground the radar product observes reads flooded on 8 April 2019. on the GFM. No built-up figure is published. ↩
- A 2019 building count is a floor on what stood. ↩
- In March the baseline covers The March baseline is known for 98.9% of Khuzestan outside permanent water. of the province. The other 1.1% of Khuzestan outside permanent water has no March baseline and no optical flood figure. has no optical flood figure. Its normal water is from 2014 to 2018, drier years than 2019, and the water that stood before the rain is removed only where the 16 March view is clear. ↩
- 395 km² of optical flood on the north-eastern hill block of Khuzestan does not repeat across dates and is not in the hybrid flood map. of optical flood on the hill block does not repeat across dates. It is drawn on each optical date and is not in the hybrid map. ↩
- CHIRPS is a satellite and gauge estimate at about 5 km. CHIRPS wet-season totals CHIRPS wet-season totals miss the GPCC gauge record by 82 mm on average, 2000 to 2010, and may under-represent extremes. Funk, C. et al. (2015). The climate hazards infrared precipitation with stations, a new environmental record for monitoring extremes. Scientific Data 2, 150066. https://doi.org/10.1038/sdata.2015.66 and may under-represent extremes. No gauge record was read, and a province mean is a mean of estimated cells. ↩
- The basin follows the edges of HydroBASINS level 6 polygons, not the divide itself. ↩
- The accuracy reference is scored on The optical map is scored against the six EMSR352 grading products of 11 April 2019 on 983 km², over towns. , over towns, on one date. ↩
- The delineation is 18.5% of the flood the EMSR352 delineation of 8 April 2019 maps was water on the April baseline, on the 43,596 km² both optical sensors score. standing water and was taken The EMSR352 delineation image of 8 April 2019 was taken 4.74 hours before the Sentinel-2 pass. earlier. ↩
- The EMSR352 delineation draws no layer and enters no figure. The flood the EMSR352 delineation alone maps on 8 April 2019 is 36.9% of its own flood. of its flood is mapped by neither the optical map nor the GFM. ↩
References
- Farjam, M., Kalantari, K., Asadi, A. and Barati, A. (2026). Assessing governance, policy, and operational gaps driving the water crisis in Iran's Greater Karun Basin. Environmental Challenges, 101670. https://doi.org/10.1016/j.envc.2026.101670
- Fazel-Rastgar, F. (2020). Extreme weather events related to climate change: widespread flooding in Iran, March-April 2019. SN Applied Sciences 2(12), 2166. https://doi.org/10.1007/s42452-020-03964-9
- United Nations and Plan and Budget Organization of the Islamic Republic of Iran (2019). Post Disaster Needs Assessment: Iran 2019 floods in Lorestan, Khuzestan and Golestan provinces. United Nations Iran, October 2019. https://iran.un.org/sites/default/files/2021-08/IRAN_FLOODS_2019_(Final_Report)_En_2019.pdf
- France 24 (2019). Iran floods death toll reaches 70. France 24, 5 April 2019. https://www.france24.com/en/20190405-iran-floods-death-toll-reaches-70
- Heidari, A. (2014). Flood vulnerability of the Karun River System and short-term mitigation measures. Journal of Flood Risk Management 7(1), 65. https://doi.org/10.1111/jfr3.12032
- Copernicus Emergency Management Service (2019). Rapid mapping activation EMSR352, Iran floods. Copernicus Emergency Management Service. https://mapping.emergency.copernicus.eu/activations/EMSR352/
- Barrington-Leigh, C. and Millard-Ball, A. (2017). The world's user-generated road map is more than 80% complete. PLoS ONE 12(8), e0180698. https://doi.org/10.1371/journal.pone.0180698
- Funk, C. et al. (2015). The climate hazards infrared precipitation with stations, a new environmental record for monitoring extremes. Scientific Data 2, 150066. https://doi.org/10.1038/sdata.2015.66